GLM.Variations
Reading: Goldburd, M.; Khare, A.; Tevet, D.; and Guller, D., "Generalized Linear Models for Insurance Rating,", CAS Monograph #5, 2nd ed., Chapter 10.
Synopsis: This article looks at ways we can extend the standard GLM concept to handle non-linearity and variable selection more efficiently. We consider Generalized Linear Mixed Models, GLMs with dispersion modeling, Generalized Additive Models, MARS models, and elastic net GLMs. They are covered in theory along with a few practical implementation tips but no calculations are required.
Study Tips
- Revisit this material several times during your studies to keep it fresh. The material lends itself to multiple choice and free form answer types of questions which should be quick and easy points on the exam.
- Pay close attention when learning how to read the tables of model output. Be sure to revisit the standard GLM material to ensure you understand the differences between the approaches.
Estimated study time: 4 Hours (not including subsequent review time)
BattleTable
Based on past exams and our opinion of the syllabus, the main things you need to know (in rough order of importance) are:
- Describe the five limitations of the standard GLM approach.
- Describe the advantages and disadvantages of each way of extending a standard GLM.
- Describe how to set up a GLMM.
- Explain the concept of shrinkage and how it affects the model coefficients.
reference part (a) part (b) part (c) part (d) Currently no prior exam questions
| Full BattleQuiz | Excel Files | Forum |
You must be logged in or this will not work.
In Plain English!
By now we've seen GLMs are flexible, robust and, most importantly, highly interpretable. However, they're not perfect.
Question: Briefly describe five limitations of GLMs.
- Solution:
- Predictions are a linear function of the predictors unless the modeler manually intervenes using hinge functions, polynomials, etc.
- Instability occurs if the predictors are highly correlated or there is limited data available.
- The data is always considered fully credible.
- GLMs assume the random component of the outcome is uncorrelated among risks.
- The exponential family parameter, [math]\phi[/math], is constant across all risks.
Question: Briefly explain a drawback of adopting advanced predictive modeling techniques such as neural nets, random forests, or gradient boosting machines which do not have the above flaws.
- Solution:
- Using these types of advanced techniques results in the loss of interpretability. Actuaries value being able to explain how changes to the input parameters alter the prediction as this allows them to guide business decisions and overcome regulatory concerns.
This reading introduces some ways we can extend GLMs to address the limitations to increase accuracy with minimal loss of interpretability.
Generalized Linear Mixed Models (GLMMs)
The GLMs we've studied so far assume there is some underlying set of fixed predictors which perfectly model the data. The standard GLM approach of fitting using maximum likelihood "moves" the coefficients of these predictors as close as possible to the data even when the data is thin. That is, a GLM considers the data to be fully credible.
Since we have a sample of the data universe, we know there is randomness associated with the estimates we receive in the GLM output. This is expressed via statistics such as the standard error. However, maybe with more time and computational power we could get a bigger data set and split it into two more homogeneous subsets. Using the same set of predictors in each case, we can run a GLM on the entire data set and also on each of the subsets. The results likely show slightly different estimates of the coefficients for some of the predictors. Some of this is due to the randomness associated with estimating parameters but some of it could also be the two subsets should actually be modeled by two slightly different sets of coefficients for the same predictors.
A generalized linear mixed model (GLMM) allows you to model some of the coefficients as random variables. This allows us to capture the idea that we have the right set of predictors but there is likely some variation in the coefficients of those predictors depending on which subset you lie in.
In a GLMM, predictors with coefficients modeled as random variables as called random effects and are denoted by z1, z2, ..., while those predictors whose coefficients are considered fixed are called fixed effects and are denoted with the usual x1, x2, .... In practice, random effects are usually used for categorical predictors that have many levels — rating territory for example.
Alice: "Pay attention to the following important difference!"
IMPORTANT! Variables which are modeled as random effects do not contain a base level.
The GLM text presents the following example of setting up a GLMM.
Example: Auto severity is modeled using three predictors: Driver age (x1, continuous), marital status (x2, 0 = married / 1 = married), and rating territory (categorical with 15 levels, z1, ..., z15). Driver age and marital status are modeled as fixed effects while rating territory is chosen to be random effect because the underlying data is concentrated in a handful of the territories and sparse elsewhere. The setup for a GLMM in this situation is:
[math]\begin{align} y & \sim \textit{gamma} \left(\mu_i,\phi\right) \\ g(\mu_i) & = \beta_0 + \beta_1 x_1 +\beta_2 x_2 + \gamma_1 z_1 + \ldots \gamma_{15} z_{15} \\ \gamma & \sim \textit{normal}\left(\nu, \sigma\right) \end{align} [/math]
Here y is our target variable, auto severity. The key difference here is we've introduced a probability distribution for the fifteen γ parameters. They are assumed to be independent and identically distributed.
Since we're modeling auto severity, a gamma distribution was chosen but any member of the exponential distribution family could be used. Similarly, the GLM text chose to model the γ parameters from a normal distribution but you can use other distributions if you wish. Notice the design matrix now includes 15 dummy-coded (0/1) columns for territory rather than 14.
Maximum likelihood can still be used to solve the setup but now, in our above example, there are two distributions in play. The distribution of auto severity outcomes and the distribution of random effects for territory. As the γ coefficients become closer to those "found in the data" (i.e. closer to the gamma coefficients that we'd get if we had treated territory as a fixed effect), we increase the likelihood of the data. This means a GLMM produces estimates that are somewhere between the full credibility estimates that come from a standard GLM, and the grand mean. As the volume of data decreases for a random effect, its GLMM coefficient moves from the standard GLM coefficient (fully credible) towards the grand mean. This is referred to as shrinkage.
Alice: "What's all this about grand means? The GLM text doesn't define what it is so we'd best refresh our statistical knowledge."
The grand mean is the mean of means. To put this into context, suppose we're looking at auto severity and have three territories (A, B, and C) which have 3, 4, and 8 claims respectively with average severities of $10,000; $16,000; and $7,000. The auto severity grand mean for territory is (10,000 + 16,000 + 7,000) / 3 = $11,000. Notice this is not the same as the overall mean which is (3 * 10,000 + 4 * 16,000 + 8 * 7,000) / (3 + 4 + 8) = $10,000.
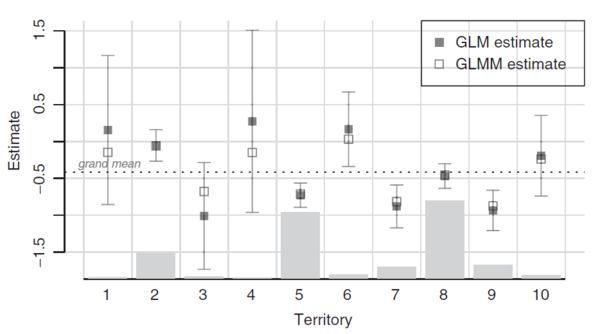
Figure 1 below is from the text. It contrasts GLM and GLMM output for a territory variable with 10 levels. The light grey bars show the volume of data within each territory. The solid boxes and confidence intervals show the standard GLM coefficients and associated 95% confidence intervals. Lastly, the unfilled boxes show the GLMM coefficients and the horizontal dotted line represents the grand mean. The key takeaways are:
- The confidence intervals associated with the GLM increase as the volume of data decreases.
- The GLMM coefficients lie between the GLM coefficient and the grand mean, moving closer to the grand mean as the volume of data decreases.
How to Fit a GLMM
This is a two-step process.
- Estimate all of the "fixed" parameters. This means we get estimates for all of the [math]\beta_i[/math] coefficients, plus the dispersion parameter, [math]\phi[/math], and estimates for the grand mean, [math]\nu[/math], and its associated variance, [math]\sigma[/math], which are the parameters of the random effects distribution. We get a separate estimate [math](\nu, \sigma)[/math] for each predictor whose levels are treated as random variables but critically same estimate applies to all random effects for a given predictor.
- A Bayesian procedure then estimates the coefficients for each set of random effects by taking into account the volume of data and the randomness specified by the chosen random effects distribution with mean [math]\nu[/math] and variance [math]\sigma[/math].
Comparison to Bühlmann-Straub Credibility
A GLMM is a way of introducing classical credibility into a GLM for multi-level categorical variables. The dispersion parameter, [math]\phi[/math], represents the "within-variance" (residual variance) while the variance of each set of random effects is analogous to the "between-variance". As the ratio of the within-variance to the between-variance increases, the GLMM estimate moves closer to the standard GLM estimate.
Correlation Among Random Outcomes
A multi-year dataset may contain correlation between records. For example, consider a poor driver who remains with their insurer for many years. A data set which contains multiple renewals (of this insured) could distort the results of a standard GLM. The GLM text suggests including a policy identifier in a GLMM as a random effect is a way to control for this.
mini BattleQuiz 1 You must be logged in or this will not work.
GLMs with Dispersion Modeling (DGLMs)
The standard GLM approach requires the dispersion parameter, [math]\phi[/math], to be constant across all records. A double-generalized linear model (DGLM) has a dispersion modeling component which allows each record to have a unique dispersion parameter which is determined by some linear combination of predictors. Mathematically we have:
[math] \begin{align} y_i & \sim \textit{Exponential}\,(\mu_i,\sigma_i) \\ g(\mu_i) & = \beta_0 + \beta_1 x_{i,1} + \beta_2 x_{i,2} + \ldots + \beta_p x_{i,p}\\ g_d(\phi_i) & = \gamma_0 + \gamma_1 z_{i,1} + \gamma_2 z_{i,2} + \ldots + \gamma_n z_{i,n} \end{align} [/math]
IMPORTANT!
- We're using [math]\gamma[/math] and [math]z_i[/math] in the above notation but this does not mean we're treating those variables as random effects!
- There is no requirement for the dispersion parameter to use the same predictors or even the same number of predictors as the linear predictor, [math]g(\mu_i)[/math].
- The link functions [math]g[/math] and [math]g_d[/math] need not be the same. In practice though, it's common for them to both be the log link.
Approximating a DGLM
Most statistical software contains a way of implementing a DGLM. However, when the distribution is either normal, Poisson, gamma, inverse Gaussian, or Tweedie, a DGLM can be closely approximated by a GLM using an iterative process as follows:
- Set each [math]\phi_i = 1[/math].
- Set the weight for each record as [math]\frac{\omega_i}{\phi_i}[/math] where [math]\omega_i[/math] is the regular weight you would have chosen in a GLM. Run a standard GLM using these weights to estimate the [math]\beta[/math] coefficients.
- Calculate the unit deviance, [math]d_i = 2\phi_i\left[\ln\left(f(y_i \mid \mu_i = y_i)\right) - \ln\left(f(y_i \mid \mu_i = \mu_i)\right) \right][/math] for the GLM output. This is the record's contribution ot the total unscaled deviance.
- Run a GLM whose target variable is the unit deviance. Use a gamma distribution and the predictors can be any variables which you think will affect dispersion.
- Set [math]\phi_i[/math] to be the output of step 4 above.
- Iterate through steps 2 through 5 until the model parameters cease to change significantly between iterations.
Alice: "For a Tweedie distribution the unit deviance formula simplifies to [math]d_i = 2\omega_i\left( y_i\frac{y_i^{1-p}-\mu_i^{1-p}}{1-p} - \frac{y_i^{2-p}-\mu_i^{2-p}}{2-p} \right)[/math]. I don't think you need to spend time memorizing this formula."
Where to Use a DGLM
A DGLM may produce better predictions than a GLM when some classes of business are naturally more volatile than others. By letting the dispersion parameter "float" the DGLM gives greater weight to stable historical data than it does to volatile past experience. In theory this means we pick up more signal and less noise.
Two cases when a DGLM may be more helpful are:
- When the full distribution of the target variable is required rather than just the mean value. For example, when using a GLM to model reserving distributions. A DGLM models two parameters [math](\mu_i, \phi_i)[/math] so is more flexible for fitting distributions.
- When modeling pure premiums or loss ratios using a Tweedie distribution we're forced to assume all predictors have the same directional effect on frequency and severity. Using a DGLM introduces flexibility so the model can better match the frequency and severity effects seen in the data without having to have a separate model for each.
Generalized Additive Models (GAMs)
GLMs assume the set of predictors form a linear combination. We can incorporate non-linear effects through time consuming manual transformations of the variables (such as through introducing hinge functions). A generalized additive model (GAM) incorporates non-linearity from the beginning. Mathematically we have:
[math] \begin{align} y_i &\sim \textit{Exponential} \, (\mu_i, \phi) \\ g(\mu_i) &= \beta_0 +f_1(x_{i,1}) + f_2(x_{i,2}) + \ldots + f_p(x_{i,p}) \end{align} [/math]
Now the linear predictor is a function of functions of predictors. We can still use a log-link function to produce a multiplicative model.
Question: Briefly describe two disadvantages of using a GAM instead of a GLM.
- Solution:
- A GAM has no easy way to describe the impact changing a predictor variable has on the model. With a GLM we could look at the coefficient but with a GAM we have to assess graphically.
- A GAM has a greater risk of overfitting the model to your data because of the immense flexibility associated with the parameters that define the smoothness of each predictor.
The text doesn't provide any advice on fitting GAMs; instead it mentions they are available in most statistical software.
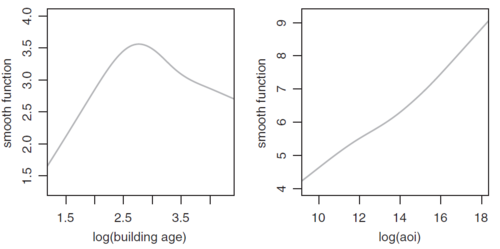
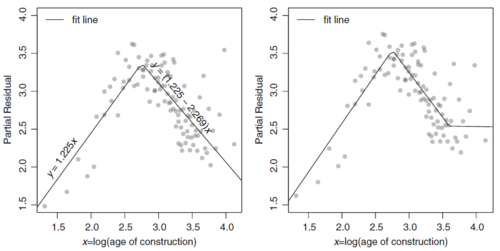
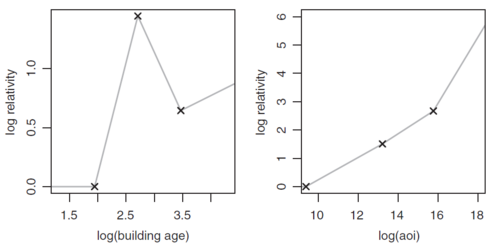
The text does provide the following illustration of a GAM. The left panel of Figure 2 below shows the GAM output for log(Age of Construction). This can be compared to Figure 3 below which shows the GLM output for log(Age of Construction) when the modeler manually used one (left panel) or two (right panel) hinge functions to produce a piecewise linear estimation. The GAM captures the effect with greater ease and smoothness.
In the right panel of Figure 2 above, the GAM output is nearly linear with little curvature. This suggests that a linear approximation, i.e. using a GLM approach is probably sufficient for this variable.
MARS Models
A different approach to non-linearity is known as multivariate adaptive regression splines (MARS). This approach uses piecewise linear functions (hinge functions) instead of the arbitrarily smooth functions found in a GAM. The key advantage of MARS is it creates the hinge functions and optimizes the break points automatically.
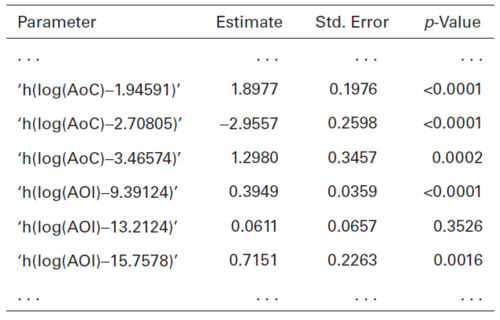
The GLM text continues to look at fitting curves for the Age of Construction and Amount of Insurance variables. Figure 4 below provides their partial table of MARS output.
The ... at the top and bottom of the table emphasize this is a partial table. However, all rows for the Age of Construction and Amount of Insurance variables are shown. Figure 4 should be compared against Figure 3 above where the modeler manually chose the break points for the Age of Construction to be 2.75 and 3.5. The MARS output for Age of Construction produced break points at 1.94591, 2.70805, and 3.46574. The second and third of these are very close to what our modeler identified.
Important! For a refresher on hinge functions in general, click here. A key difference between the MARS output in the above example and the general hinge function output is the lack of a log(AoC) or log(AOI) row. This means the AoC response curve for the model is flat below 1.94591 which by exponentiating translates to a flat curve for buildings under 7 years old. Similarly, though less material, the AOI response curve for the model is flat below [math]e^{9.39124}[/math], i.e. flat for amounts of insurance less than about $12,000. Figure 5 below illustrates the response curves with an X shown at each break point.
MARS procedures are available in most statistical software and the GLM text doesn't describe how to produce them. However, it does warn the reader that MARS procedures contain tuning parameters that control the flexibility of the fit. The greater the flexibility, the more break points are used which increases segmentation at the risk of overfitting and turning up spurious effects.
Question: Briefly describe three advantages of using a MARS model.
- Solution:
- MARS models automatically handle non-linearity in the predictors.
- MARS only keeps significant variables. Tuning parameters control how many variables are retained. In contrast, a GLM produces a coefficient for each predictor regardless of whether it is significant.
- MARS models can search for significant interactions. These can be 2-way or 3-way or even higher-way interactions and it can detect interactions between piecewise linear functions.
mini BattleQuiz 2 You must be logged in or this will not work.
Elastic Net GLMs
Parsimony is the goal of using just enough predictors to produce a good model that fits the data well (no overfitting) yet isn't too simplistic to be of limited future value. A GLM finds coefficients which minimize the deviance of the training data set. When we feed the GLM with a large number of potential predictors this means we can overfit and get statistically significant output that is not predictive of future behavior. It is challenging for the modeler to manually decide which predictors to keep.
An elastic net GLM is a GLM specified in the usual way but where the coefficients are fit differently by including a penalty term. This penalty term increases the deviance according to the number of coefficients and their magnitude.
An elastic net GLM minimizes [math]\textit{Deviance} + \underbrace{\lambda\left(\alpha\sum|\beta| + (1-\alpha)\frac{1}{2}\sum\beta^2\right)}_{\text{penalty term}}[/math].
IMPORTANT! The intercept term, [math]\beta_0[/math] is not included in the penalty term.
The penalty term consists of a parameter [math]\lambda[/math] multiplied by a weighted average. The weighted average is determined by our choice of [math]0 \le \alpha \le 1[/math]. A weighted average is used because an elastic net is a generalization of the lasso model whose penalty term only uses the absolute value of the coefficients, and the ridge model whose penalty term only uses the squares of the coefficients. The weighted average is always positive and increases as parameters are added to the model (when [math]\alpha[/math] is fixed). The weighted average penalizes for larger coefficients, in terms of the magnitude of the coefficient and how they deviate from zero.
A lot goes on behind the scenes in an elastic net GLM. In particular, the predictors are centered and scaled before the GLM is fitted. This is essential to ensure all of the [math]\beta[/math] coefficients are on similar scales else one or more predictors could dominate the penalty term. Most implementations of an elastic net GLM return the coefficients on the original scale of each variable.
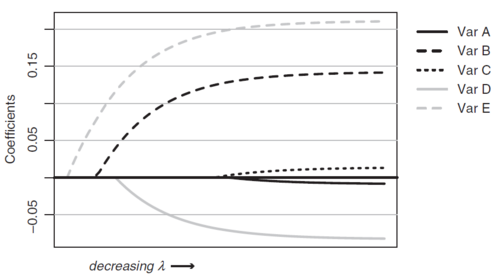
The tuning parameter, [math]\lambda[/math], is the most important aspect because it controls the severity (size) of the penalty. As [math]\lambda[/math] increases, to minimize the function requires the coefficients of the GLM to become closer to 0 to compensate for the increased penalty. This can force less important predictors to receive 0.000 coefficients which essentially removes them from the model. Cross validation is typically used to tune the [math]\lambda[/math] parameter.
The GLM text includes Figure 6 below to illustrate how increasing the severity of the penalty term results in variables being removed from the model. The earlier a variable starts showing non-zero coefficients as [math]\lambda[/math] goes towards 0, the greater the significance of that variable. In Figure 6, variable E is the most important, followed by B then D.
When [math]\lambda[/math] is zero we get the standard GLM coefficients. Since the penalty term causes the coefficients to go to 0, elastic net GLMs exhibit the shrinkage effect although the coefficients are shrinking towards 0 rather than the grand mean for the predictor. This means we can think of elastic net GLMs as a way of incorporating credibility into GLMs.
Question: Briefly describe two advantages of using an elastic net GLM.
- Solution:
- Elastic net GLMs can perform automatic variable selection because the penalty term leads to less important variables being assigned 0.000 coefficients.
- Elastic net GLMs perform better than standard GLMs when variables are highly correlated. What generally happens is one or two of the predictors in a set of correlated predictors receive moderate coefficients and the rest are automatically removed. In contrast, a standard GLM may find its coefficients for these predictors "blow up" — the penalty term of the elastic net GLM prevents this happening.
Question: Briefly describe a disadvantage of using an elastic net GLM.
- Solution:
- Elastic net GLMs are much more computationally intensive and time consuming than standard GLMs. This can make them impractical for large data sets.
| Full BattleQuiz | Excel Files | Forum |
You must be logged in or this will not work.
